Track your HbA1c over time — not just today
What is HbA1c?
HbA1c (glycated haemoglobin) reflects your average blood glucose over the past 2–3 months. Normal is below 5.7%; pre-diabetes is 5.7–6.4%; diabetes is 6.5% or higher on two separate tests. (ADA 2024)
A single HbA1c result tells you almost nothing about direction. Upload your past and current lab reports and Kinmetry builds the full trend automatically — so you and your doctor can see where things are actually heading.
No credit card required · Free plan · GDPR compliant
2–3 months
what one HbA1c reading reflects — not an isolated moment in time
−21%
fewer diabetes-related deaths per 1% HbA1c reduction (UKPDS, Lancet 1998)
4× / year
ADA recommended frequency when treatment goals are not being met
The number alone is not the story
Context, direction, and history are what actually matter for clinical decisions

Type 2 diabetes — does the medication need adjusting?
A single HbA1c tells you where you are today. Five results over three years show whether control is holding steady, genuinely improving, or quietly drifting. That's the information your doctor actually needs to decide whether the current treatment is working.

Pre-diabetes: is the lifestyle change having any effect?
An HbA1c of 5.9% at your last test is ambiguous without context. Trending toward 6.5% or moving back toward 5.5%? Comparing results over 18 months is the difference between "keep doing what you're doing" and "time to talk about next steps."

Tracking a parent's diabetes from another country
Reports arrive by WhatsApp over several years, from different hospitals, sometimes in Chinese. Without a way to plot the trend, there is no reliable way to know whether the past three years have been stable — or whether a slow drift has gone completely unnoticed.
How it works
Upload reports from any lab
PDF or photo, Chinese or English, one year or ten. Kinmetry reads them all.
HbA1c extracted automatically
No manual entry. The AI identifies the HbA1c value, unit, reference range, and test date from each report.
Your trend builds across every test
Upload older reports and they appear on the same timeline. The longer the history, the clearer the signal.
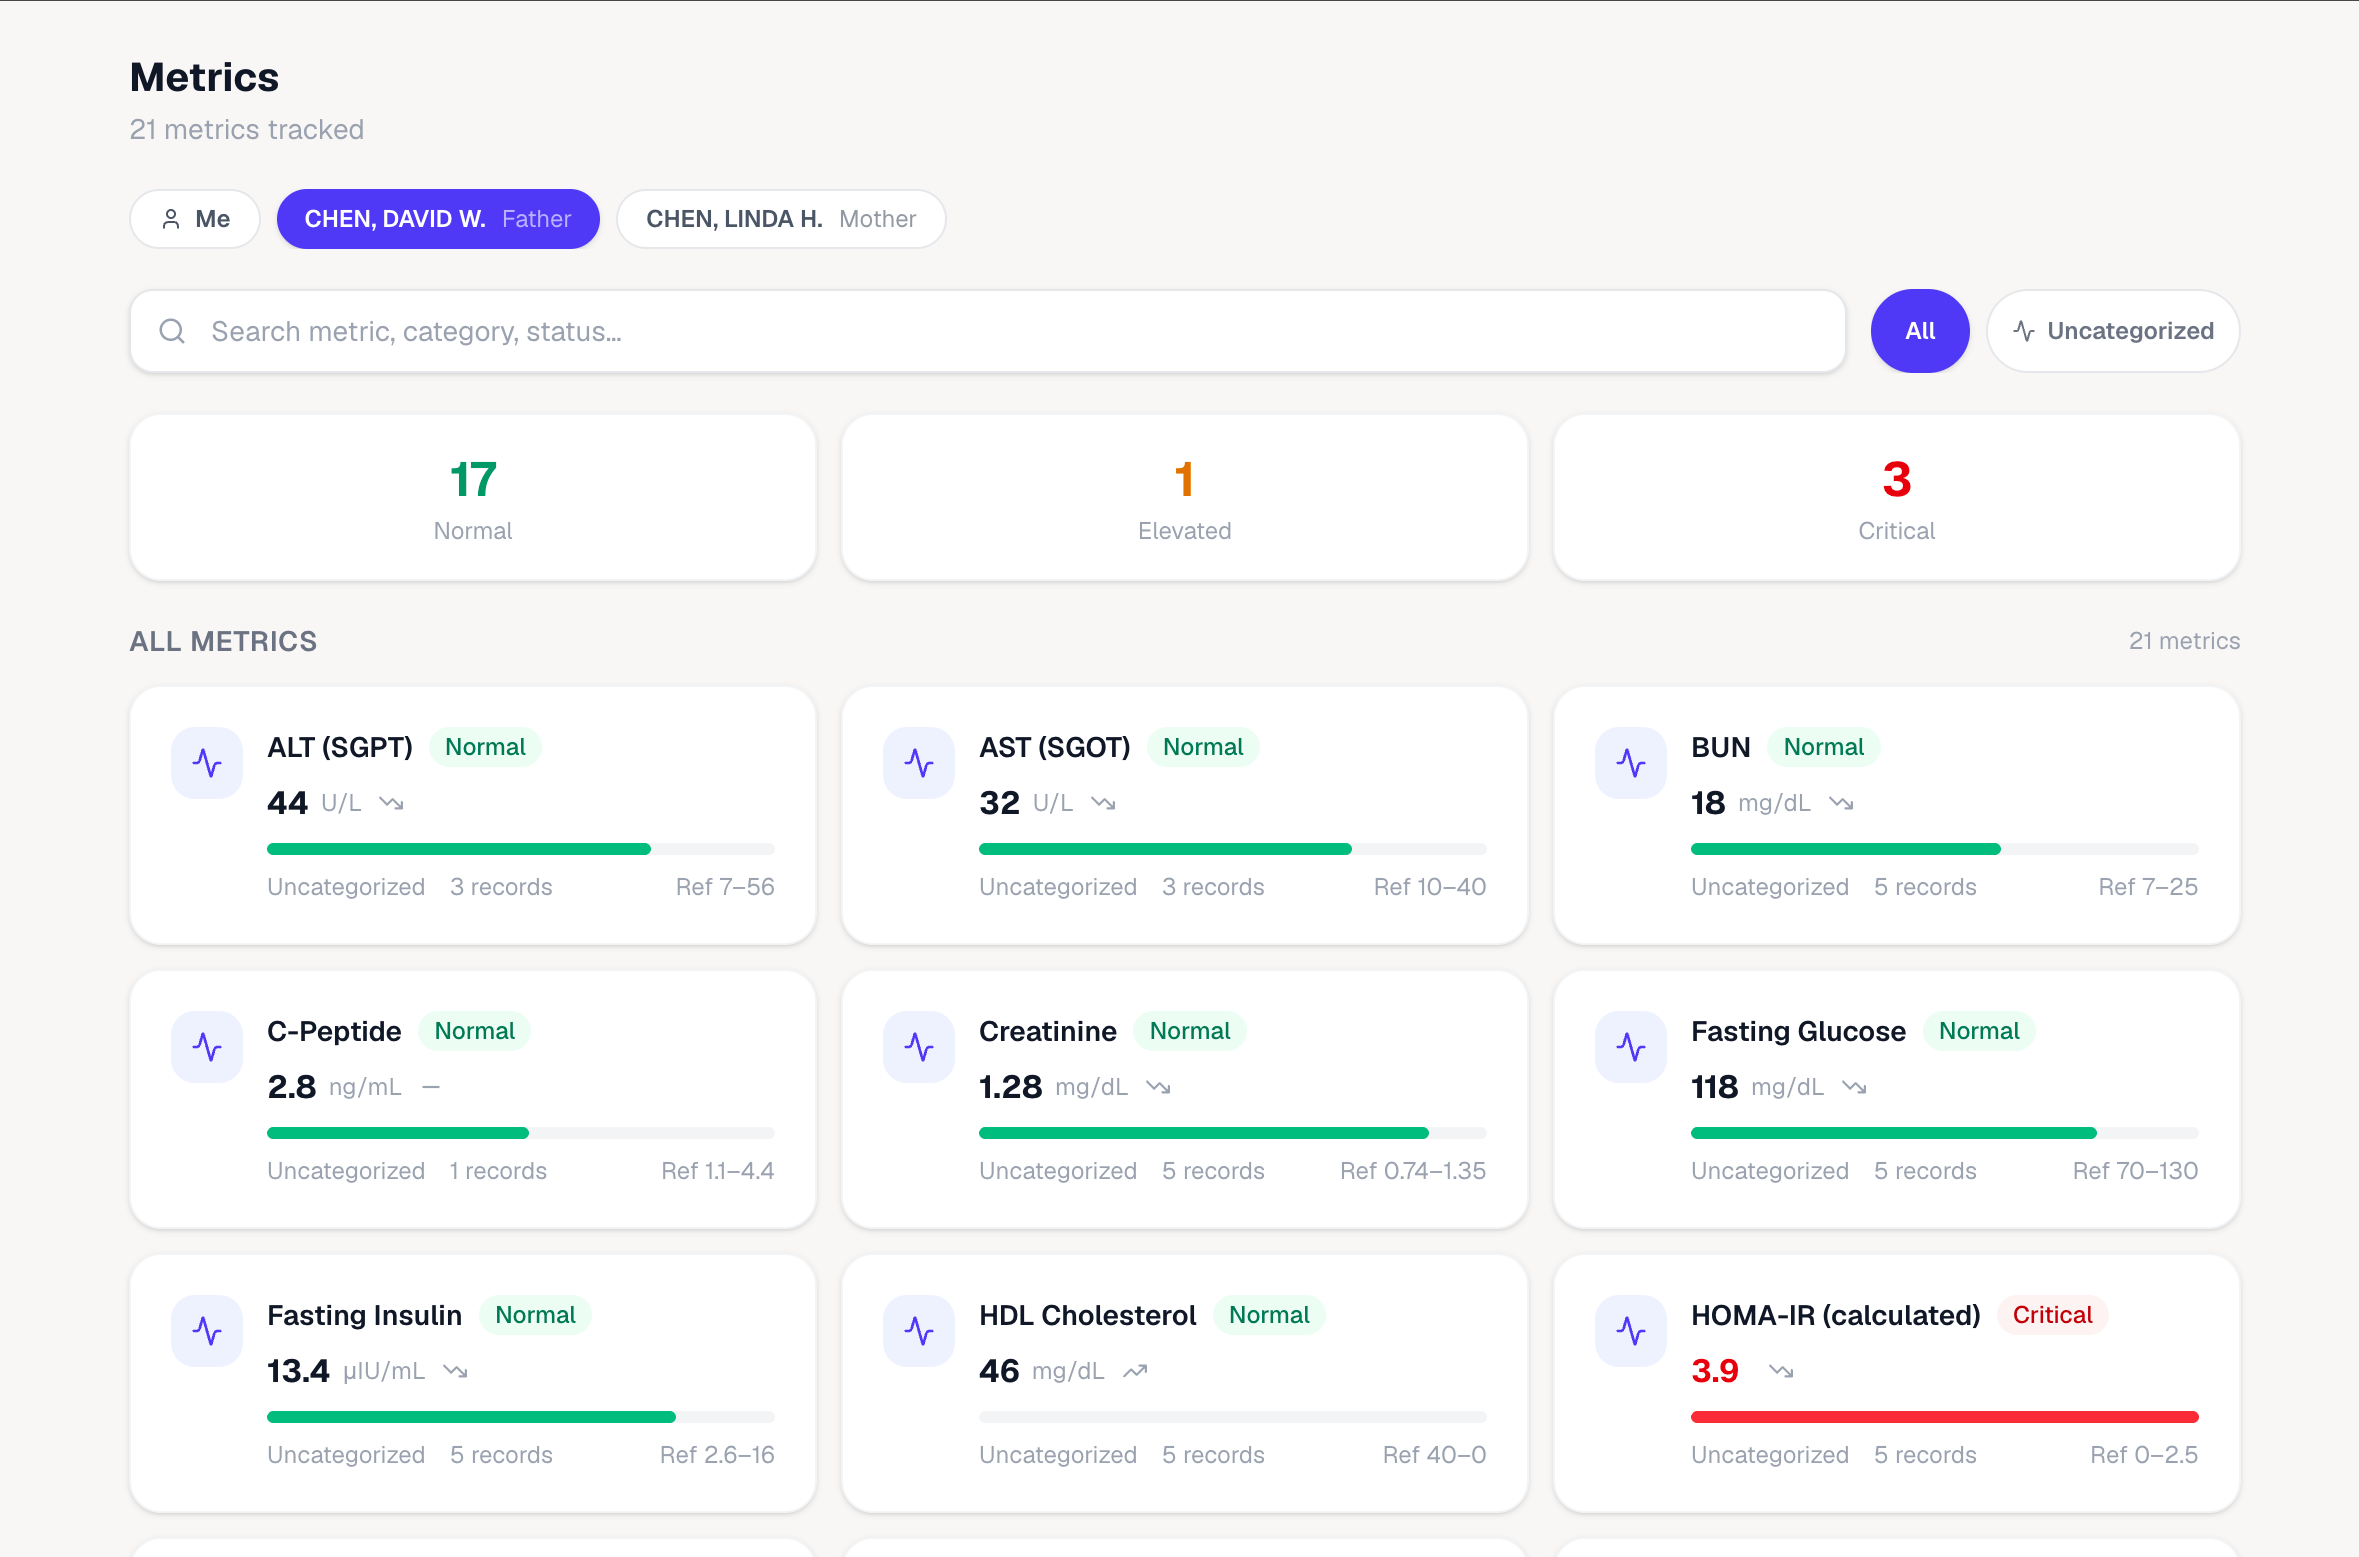
HbA1c alongside every related marker
HbA1c is one piece of the puzzle. Kidney function, liver markers, and lipids all matter — Kinmetry tracks them all on the same timeline.
200+ biomarkers tracked
HbA1c, fasting glucose, eGFR, creatinine, ALT, LDL, HDL — one timeline across all of them.
Out-of-range flags
Values outside the reference range on your report are highlighted in every chart view.
Any language, any lab
Chinese (糖化血红蛋白), Japanese, Korean, or English — all extracted and normalized.
GDPR-compliant privacy
Health data treated as Article 9 special category. Never sold. Delete everything anytime.

Your diabetes data stays private
Kinmetry treats all health data as GDPR Article 9 special category data. AI processing uses providers with Data Processing Agreements and EU Standard Contractual Clauses where required. We never sell data, never train AI on your health information, and you can export or permanently delete all records at any time.
Common questions about HbA1c tracking
What is a normal HbA1c level?
For non-diabetic adults, HbA1c below 5.7% is considered normal. The pre-diabetes range is 5.7–6.4%. A reading of 6.5% or higher on two separate tests typically confirms type 2 diabetes (American Diabetes Association Standards of Care 2024). For people already managing diabetes, the ADA recommends an individualized target — most commonly below 7%, though some clinicians target 7.5% or 8% in older adults or those with a history of severe hypoglycaemia.
How often should I test my HbA1c?
The ADA recommends HbA1c testing at least twice a year for adults with diabetes who are meeting their treatment goals, and every three months when goals are not being met or after a treatment change. People with pre-diabetes typically test once a year to check whether their level is stable, improving, or edging toward the diabetic threshold.
How does Kinmetry track HbA1c over time?
Each time you upload a lab report, Kinmetry extracts your HbA1c value, unit, test date, and reference range automatically — no manual entry. Results from multiple reports are grouped into a trend chart that builds over time. There is no cut-off date: upload reports from 2015 and 2025 and they both appear on the same timeline.
My HbA1c reports are in Chinese. Can Kinmetry read them?
Yes. Kinmetry extracts HbA1c from Chinese-language reports — the metric appears as 糖化血红蛋白 or 糖化血蛋白. The extracted value is normalized to the standard HbA1c percentage and added to the same trend chart as any English-language results you have uploaded.
What is the difference between HbA1c and fasting blood glucose?
Fasting glucose measures the concentration of sugar in your blood at one point in time — it is sensitive to what you ate the night before, stress levels, and recent illness. HbA1c reflects the average blood glucose over the past 2–3 months by measuring the proportion of haemoglobin that has become glycated. For ongoing diabetes management, HbA1c is generally more informative because it is not affected by short-term fluctuations.
References
- 1.American Diabetes Association — Standards of Medical Care in Diabetes 2024
- 2.UKPDS Group — Intensive blood-glucose control with sulphonylureas or insulin (Lancet, 1998)
- 3.WHO — Use of Glycated Haemoglobin (HbA1c) in the Diagnosis of Diabetes
- 4.CDC — Diabetes Tests and Diagnosis
- 5.NIH MedlinePlus — Hemoglobin A1c (HbA1c) Test
This page is for informational purposes only and does not constitute medical advice. Always consult a qualified healthcare professional regarding your individual health situation.
Related: Blood Test Trend Tracker · Track eGFR Over Time · Cholesterol Trend Tracker
Start tracking your HbA1c trend today
Free plan · Upload your first report now · Works with reports from any lab, any country
Create free account