Your blood test results, tracked over time — automatically
One normal result tells you almost nothing. Five results over three years tell you everything. Upload your lab reports and watch your biomarker trends build automatically — no spreadsheets, no manual entry.
No credit card required · Free plan available · GDPR compliant
Why one result is never enough
Patterns only emerge when you have the full picture

Every lab report in one place
Upload PDFs or photos from any hospital or clinic. Kinmetry extracts every value automatically — no manual entry, no spreadsheets.

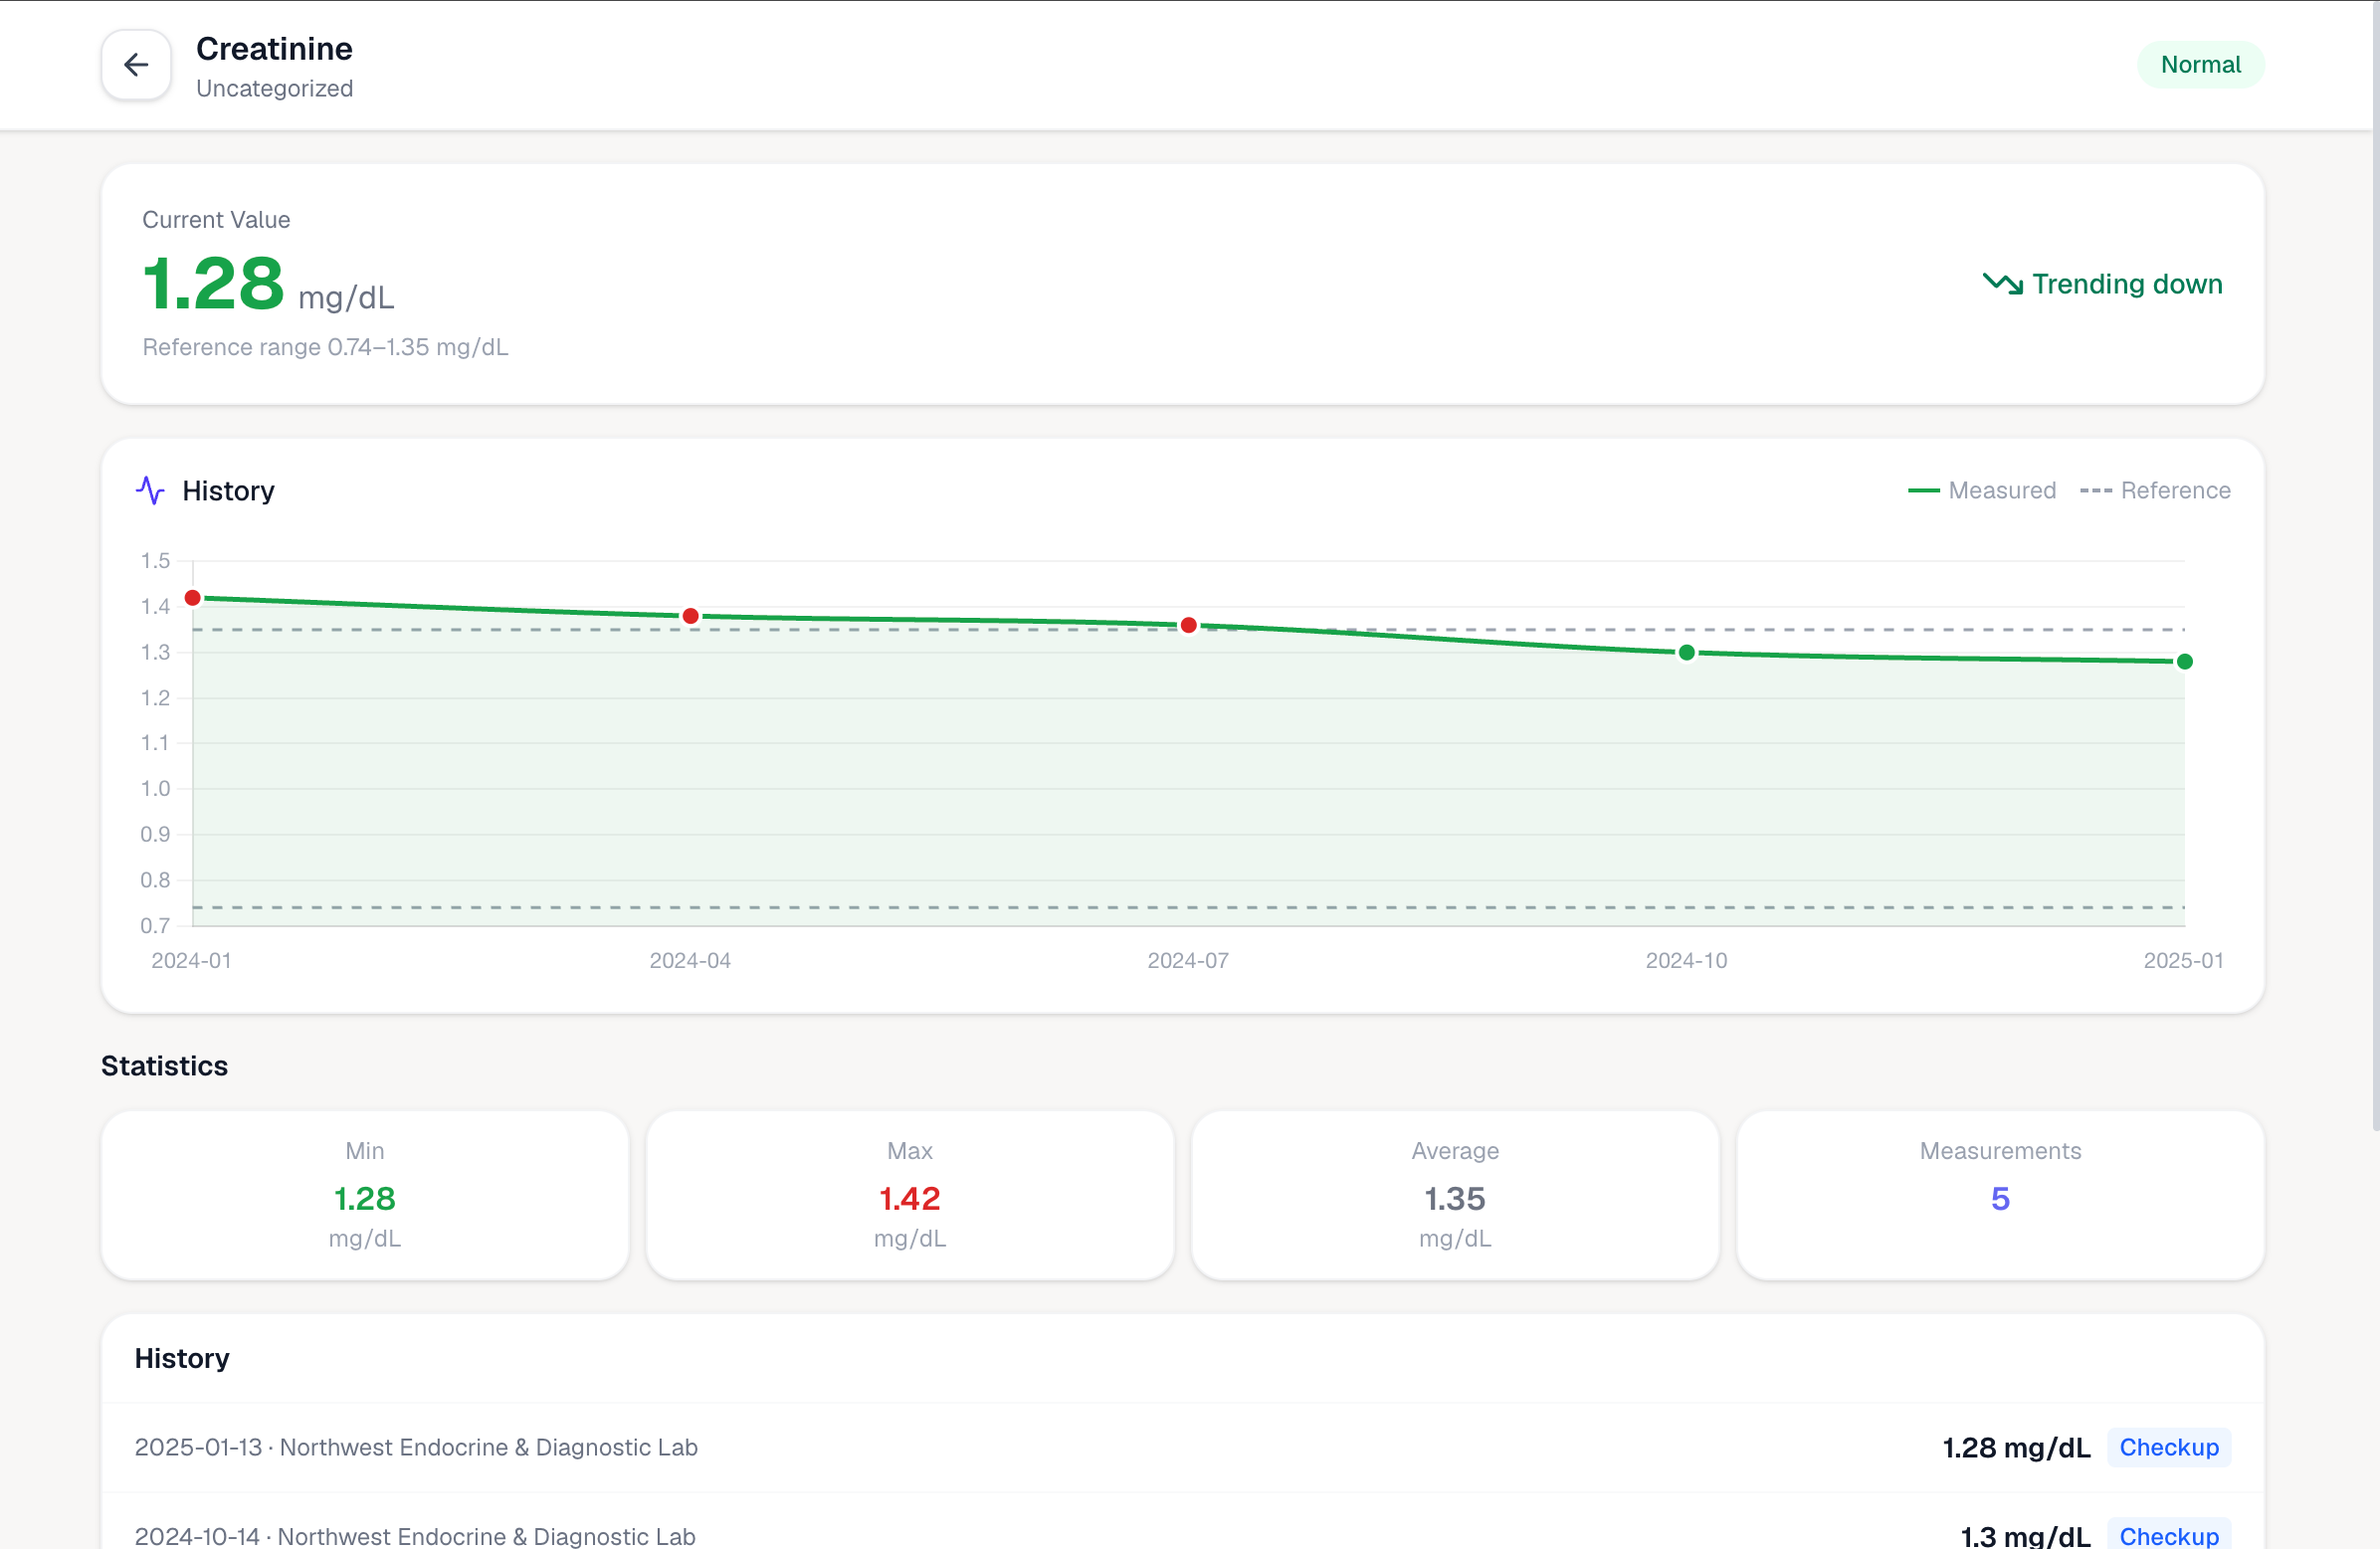
Your trend line builds automatically
Each new upload adds to your history. Biomarker charts update across every report you've ever uploaded — going back years if you have the PDFs.

Catch changes before they become diagnoses
A single out-of-range result is easy to dismiss. A three-year trend in the wrong direction is hard to ignore — and Kinmetry makes it impossible to miss.
“A single lab result tells you almost nothing. The trend across five years tells you everything.”
That's what Kinmetry is built to show you.
How it works
Upload your reports
PDF or photo from any lab — Chinese, Japanese, Korean, or English. Kinmetry reads them all.
Values extracted automatically
AI pulls every biomarker value, unit, and reference range from your report. No typing required.
Trends build across every test
The same biomarker across multiple reports becomes a chart. Upload more — the picture gets clearer.
200+ biomarkers, tracked across every report
From a basic metabolic panel to a full thyroid workup — if it's on your lab report, Kinmetry tracks it.
200+ biomarkers supported
Glucose, HbA1c, LDL, HDL, creatinine, eGFR, TSH, ferritin, vitamin D, and many more.
Out-of-range flags
Values outside your lab's reference range are highlighted across every report and chart.
Any language, any lab
Reports in Chinese, Japanese, Korean, or English — all extracted and normalized automatically.
GDPR-compliant privacy
Health data treated as Article 9 special category. Never sold. Delete everything anytime.

Your lab results stay private
Kinmetry is GDPR-compliant and treats all health data as Article 9 special category data. AI processing uses providers with Data Processing Agreements and EU Standard Contractual Clauses. We never sell data, never train AI models on your health information, and you can export or permanently delete all records at any time.
Frequently asked questions
How does Kinmetry track my blood test results over time?
Each time you upload a lab report, Kinmetry extracts the biomarker values and dates them. Results for the same biomarker across multiple reports are automatically grouped into a trend chart, so you can see how your levels have changed over months or years.
Which biomarkers can Kinmetry track?
Kinmetry tracks over 200 standard biomarkers, including glucose, HbA1c, LDL, HDL, triglycerides, creatinine, eGFR, ALT, AST, TSH, T3, T4, hemoglobin, ferritin, vitamin D, uric acid, white blood cell count, platelet count, and many more.
Do I need to manually enter my results?
No. Kinmetry uses AI to extract biomarker values directly from your uploaded PDF or photo. You upload the report — Kinmetry reads it, identifies each value, and adds it to your trend chart automatically.
My lab reports are in Chinese or Japanese. Can Kinmetry read them?
Yes. Kinmetry can extract results from reports in Chinese, Japanese, Korean, English, and most other languages. All values are normalized to international standard biomarker names so you can compare results from different labs and countries.
How does Kinmetry flag abnormal results?
Kinmetry compares each extracted value against the reference range printed on your lab report. Values outside the range are flagged and highlighted — both in individual reports and in your trend charts — so you can see at a glance which results need attention.
Start tracking your blood test trends
Free plan · Upload your first report today · Works with reports from any lab or country
Create free account